Analytics
The Analytics module is labeled "ANL" with shortcut G Y in the main navigation and focuses on market and infrastructure analytics.
The main page header shows "ANALYTICS" and an active module title "E8: Latency Monitor".
Access
- Click "Analytics" in the left navigation.
- Or use the G Y keyboard shortcut shown in the navigation bar.
Analytics apps
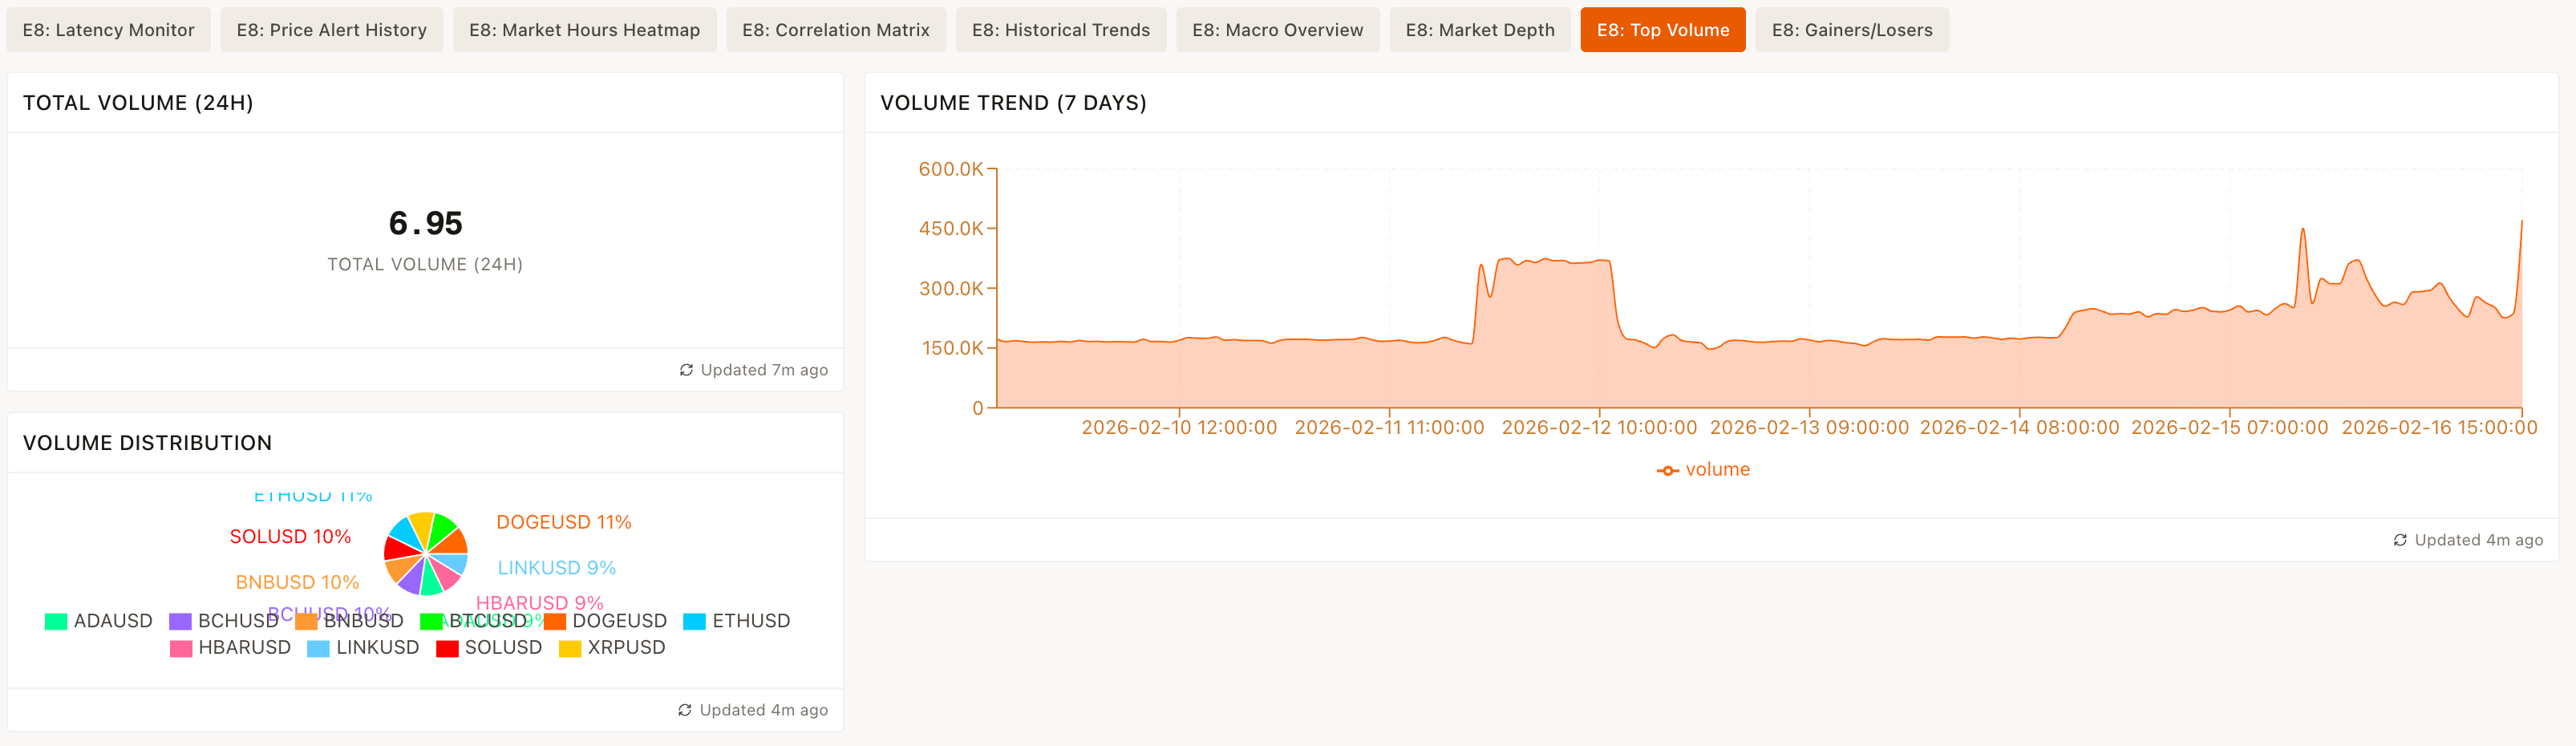
At the top of the Analytics page, you can navigate between multiple analytics apps:
- E8: Latency Monitor
- E8: Price Alert History
- E8: Market Hours Heatmap
- E8: Correlation Matrix
- E8: Historical Trends
- E8: Macro Overview
- E8: Market Depth
- E8: Top Volume
- E8: Gainers/Losers
Each item links to a dedicated analytics view under /analytics/<slug>.
Latency Monitor widgets
The default view highlights data quality and latency of the E8 feeds using multiple widgets.
AVG TOTAL LATENCY (MS)
Shows the average total latency in milliseconds across monitored symbols.
P95 TOTAL LATENCY (MS)
Displays the 95th percentile of total latency in milliseconds.
ACTIVE SYMBOLS
Shows the count of currently active symbols in the feed.
STALE SYMBOLS
Displays how many symbols are considered stale.
LATENCY TREND (1 HOUR)
Chart labeled "LATENCY TREND (1 HOUR)" that visualizes latency over the past hour.
FEED RATE TREND (1 HOUR)
Chart labeled "FEED RATE TREND (1 HOUR)" visualizing message/feed rates for the last hour.
TOP-10 WORST LATENCY SYMBOLS (1 HOUR)
A widget labeled "TOP-10 WORST LATENCY SYMBOLS (1 HOUR)" listing symbols with the highest latency.
PROBLEMATIC SYMBOLS
Widget focused on symbols currently experiencing issues.
FEED GAPS LOG
Widget listing feed gaps for diagnostic purposes.
SYMBOL LATENCY (1 HOUR)
Widget allowing inspection of latency metrics by symbol over the last hour.
FEED HEALTH STATUS
A widget summarizing overall data feed health.